
Welcome
Every engineer has a set of conversions they half remember. A wavelength at 100 Hz. How many milliseconds to that delay tower. Whether four eight-ohm cabinets on one amp is going to be fine or expensive. The rule of thumb usually gets you close, and close is usually enough, right up until the day it is not.
Audio Calculator is twenty-four of those sums, done exactly, on four pages that match the app's drawer: Wave & acoustics, Decibels & levels, Studio & digital, and Power & electronics. Every card has the same shape, with a title, the boxes you type into, and the answer in a big monospaced number, so a page holding half a dozen calculators still reads as one thing rather than a pile of unrelated forms.
The whole app is free. There is no unlock, no Pro version and no in-app purchase of any kind.
Getting started
There is nothing to set up before you can use it, but five minutes spent on Settings will make everything that follows more accurate.
- Pick your English and your units. The very first screen asks for both: UK or US English, and Metric or Imperial. Both can be changed later in Settings.
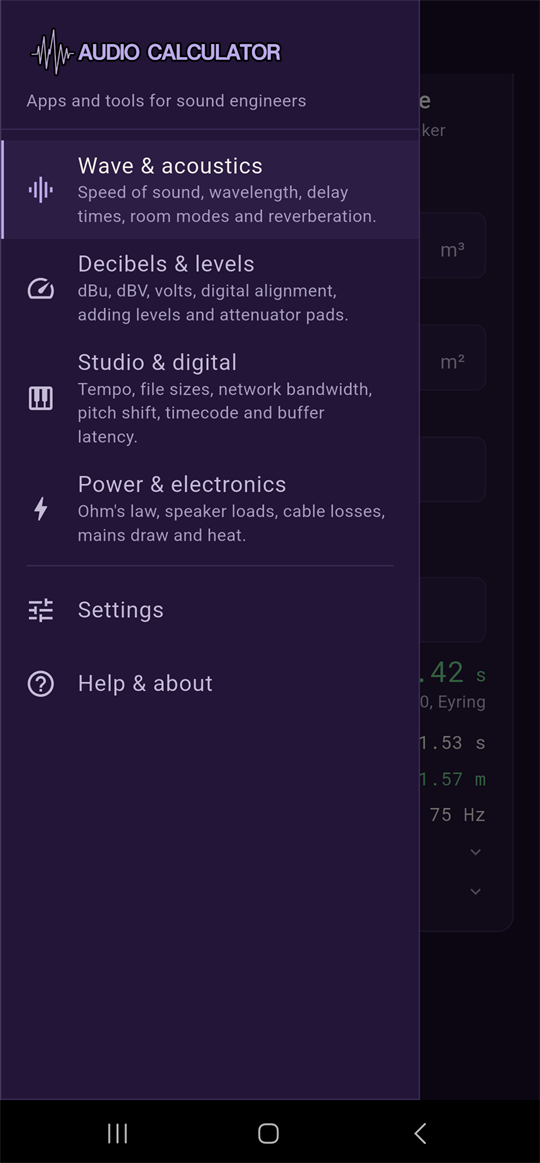
- Open the app and you land on Wave & acoustics. The four pages are all reachable from the drawer at the top left.
- Tell it the temperature. Go to Settings and put in the actual temperature where you are working. It sets the speed of sound, and the speed of sound sits underneath every wavelength, delay time, room mode and reverberation figure in the app.
- Set your units. Metric or Imperial, app-wide, in the same place.
- Set your digital defaults if you work in a studio: sample rate, bit depth and frame rate. The storage, network, latency and timecode tools all read them, so you only tell the app once.
- Find the tool you want and type into it. Most of them are two-way, so you can type into either box and the other one answers. Wavelength and frequency, time and distance, dBu and dBV and volts all work this way. There is no wrong box to start from.
- Tap "Why?" if an answer surprises you. Any answer that comes with a caveat has a collapsed Why? row underneath explaining it. Leave it closed and the card stays exactly as tall as its numbers.
- Copy the working, not just the number. Several tools have a Copy button that puts the full answer on the clipboard, including the inputs and the conditions it assumed. A delay time pasted into a show file that still says what temperature it was worked out at is worth a great deal six months later.
Page 1
Wave & acoustics
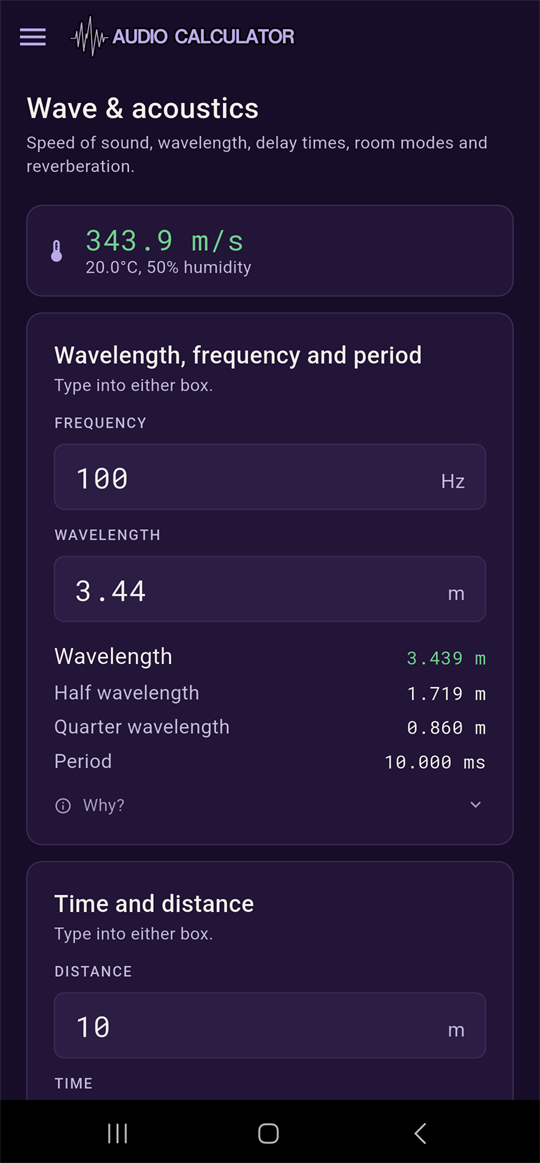
Speed of sound, wavelength, delay times, room modes and reverberation. Everything on this page runs off the single speed-of-sound figure at the top.
Wavelength, frequency and period
Type into either box, frequency or wavelength, and get the other back, along with the half and quarter wavelength and the period in milliseconds.
The quarter wavelength is the one worth knowing. It is the distance at which a boundary starts cancelling rather than reinforcing, which is why a sub placed a certain distance from a wall can lose exactly the note you needed most.
Time and distance
Type a distance or a time and get the other back, plus the same distance in the other unit system, how many samples it represents at your current sample rate, and a Copy button that takes the whole answer away with you.
This is the everyday one. Delay towers, fills, a speaker that is three metres further back than the rest of the array: they all come down to how long sound takes to travel a given distance, and the answer changes with temperature, which is why this tool reads the same speed-of-sound figure as everything else on the page.
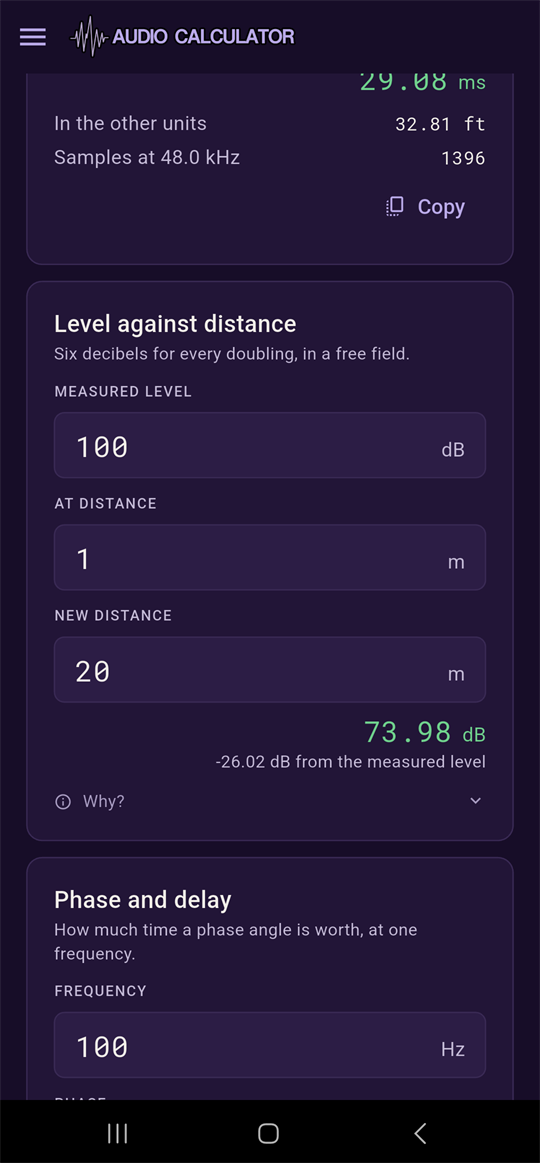
Level against distance
Six decibels for every doubling of distance, in a free field.
That rule is true outdoors, and indoors it is true only out as far as the critical distance. Past that point the reverberant field takes over and the level simply stops falling, which is why the back of a small hard room is not as much quieter than the front as you would expect. See Reverberation and critical distance for where that point actually is.
Phase and delay
How much time a phase angle is worth, at one frequency. Type into either the phase box or the delay box and the other follows, with the equivalent number of whole cycles shown alongside.
Room modes
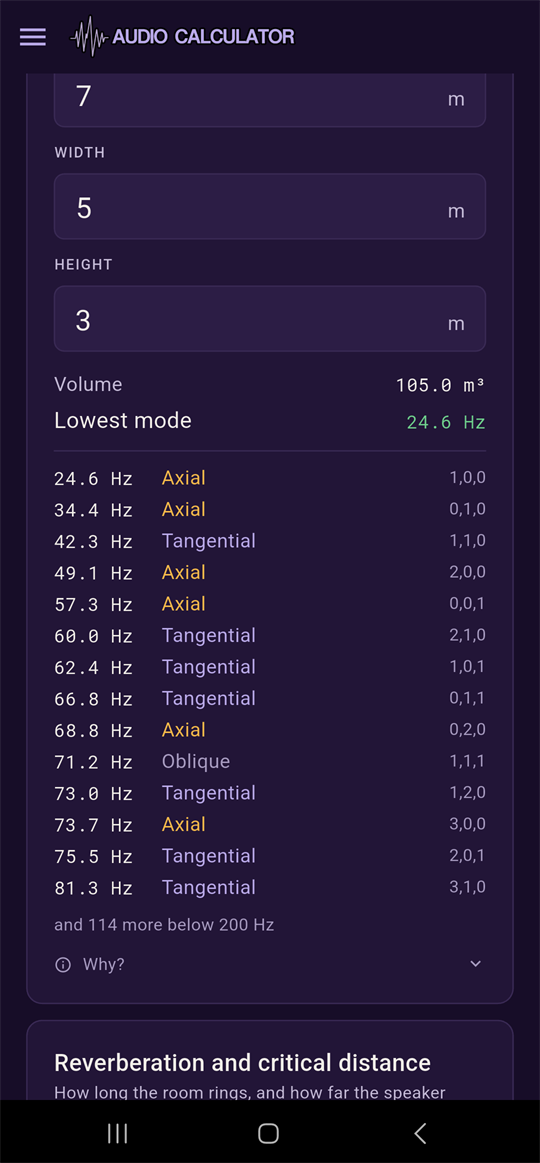
Standing waves in a rectangular room, up to 200 Hz, worked out from the length, width and height. Rows are coloured and labelled by kind.
- Axial
- Involves one pair of surfaces, and carries the most energy of the three. Treat these first.
- Tangential
- Involves two pairs of surfaces.
- Oblique
- Involves all three pairs, and carries the least energy.
Reverberation and critical distance
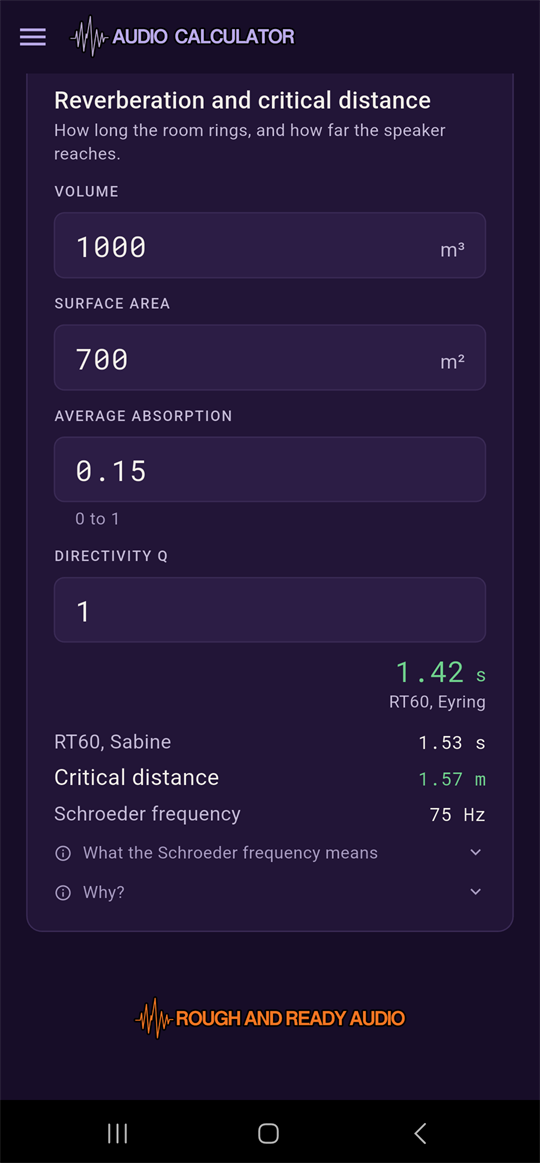
How long a room rings, and how far a speaker reaches before the reverberant field takes over, from the volume, the surface area, the average absorption and a speaker's directivity Q.
- RT60, Eyring against Sabine
- Two ways of estimating the same thing. Sabine never quite reaches zero however absorbent a room becomes, so above roughly 0.2 average absorption the Eyring figure is the one to trust.
- Critical distance
- The point at which the direct sound and the reverberant field are equally loud. Directivity Q is 1 for an omnidirectional source, 2 against a wall, and anywhere from 5 to 20 for a horn.
- Schroeder frequency
- Below it a room behaves as a set of separate resonances, and above it, statistically. It is the point where chasing individual modes stops being worth the trouble.
Page 2
Decibels & levels
Signal voltages, dynamic range, and analogue against digital.
dBu, dBV and volts
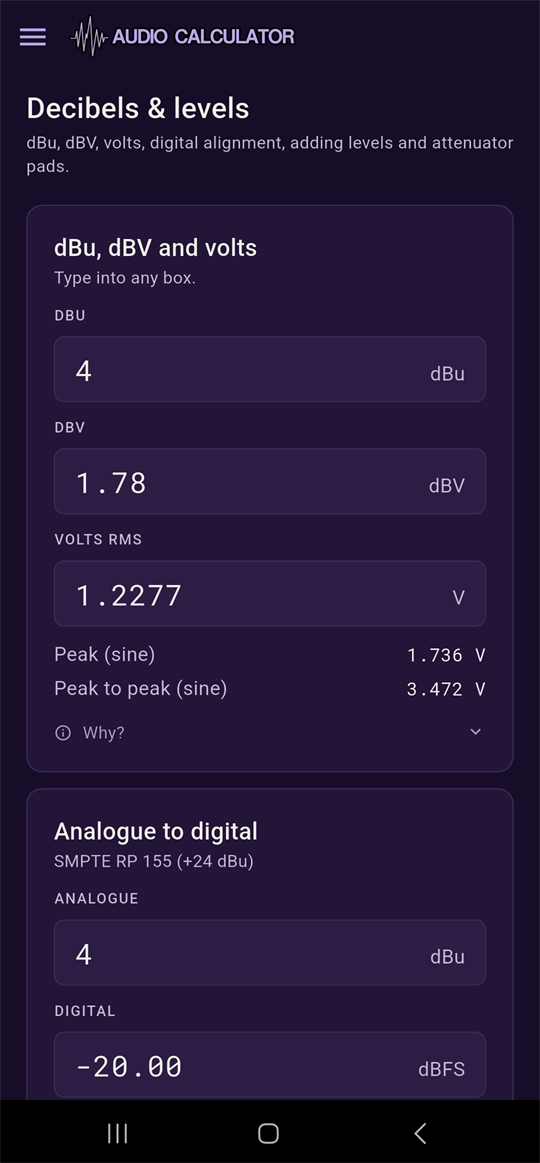
Type into any of the three boxes. Peak and peak-to-peak voltage, assuming a sine wave, appear underneath once you have entered a value.
Analogue to digital
Converts between an analogue level in dBu and where it sits in the digital domain in dBFS, using the alignment standard you chose in Settings. Once you enter a value it also shows the headroom above that level, the voltage in volts RMS, and the same level expressed in dBV.
Decibels from a ratio
The same ratio counted two ways: as a voltage, pressure or SPL figure using 20 log, and as a power or energy figure using 10 log. There is a quick-reference table of common dB steps underneath with the ratio each one represents.
Adding levels
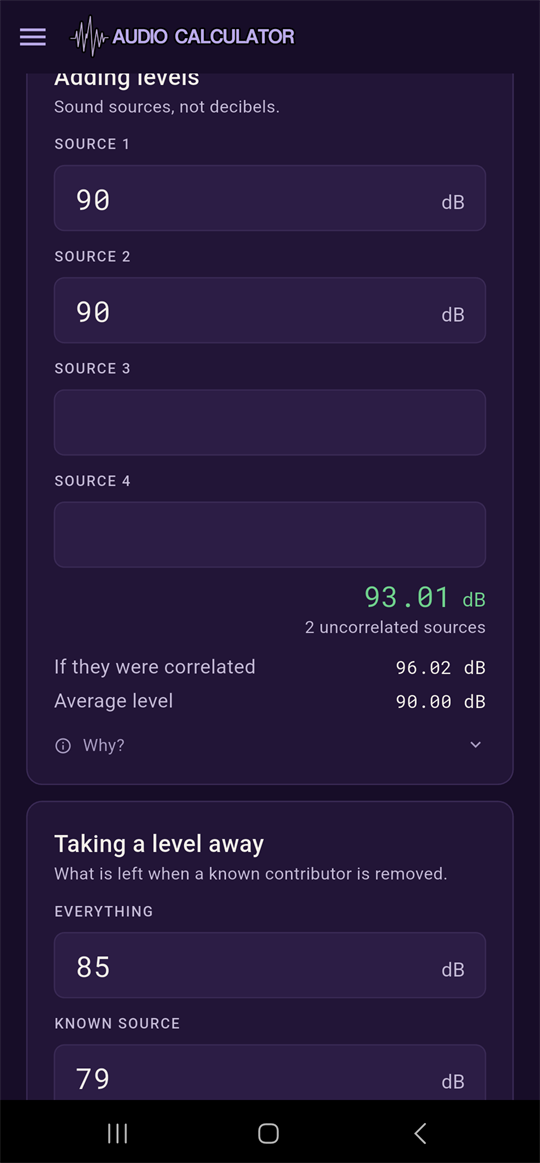
Up to four sound sources in, one combined level out. It gives you the uncorrelated answer, which is the usual case, along with what the total would be if they were correlated instead, and the plain average for comparison.
Taking a level away
What is left once a known contributor is removed from a total reading. This is how a noise floor gets measured with plant running: read everything, read the plant on its own, then subtract.
Crest factor and dynamic range
How far a signal's peaks sit above its average, from a peak figure and an RMS figure, plus a reference table of theoretical dynamic range by bit depth with your current Settings bit depth highlighted.
Attenuator pad
Resistor values for dropping a level without an active stage, for L-pad, T-pad and H-pad topologies, given a target attenuation and the line impedance.
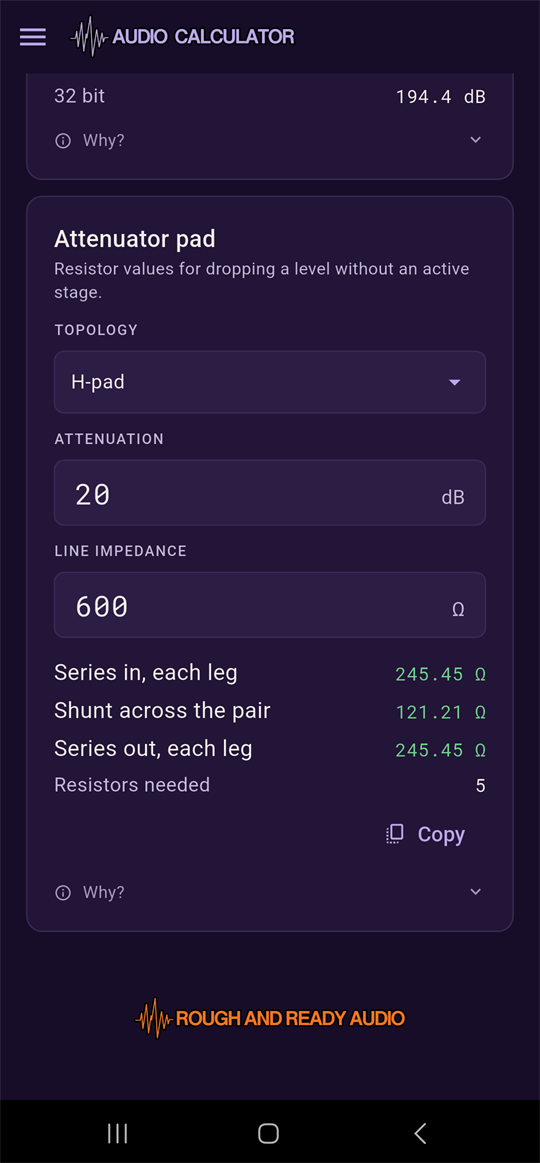
The values are exact rather than rounded to the nearest E24 part, on purpose. Rounding them silently would hide how far off the nearest real resistor actually is, and that is something you want to know before you solder it. Use a balanced H-pad on anything arriving on an XLR.
Page 3
Studio & digital
Production timing, sample rates, file sizes and video sync.
Tempo to delay time
Note lengths in milliseconds and as a rate in hertz, from a BPM figure. Half notes down to thirty-second notes, each shown as straight, dotted and triplet.
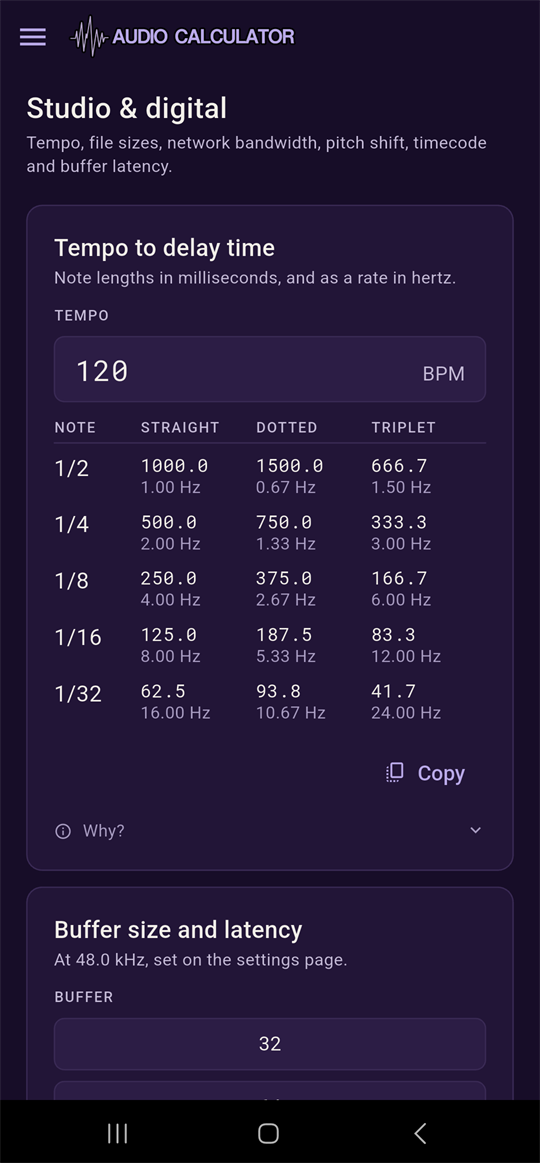
Buffer size and latency
Round-trip latency from a buffer size, 32 to 2048 samples at your Settings sample rate, and a converter latency figure. It also gives you that delay expressed as an equivalent distance from the amp, and in samples.
Recording size
File size on disk for a given channel count and duration, at your Settings sample rate and bit depth, plus how long a given drive capacity will hold at that same rate.
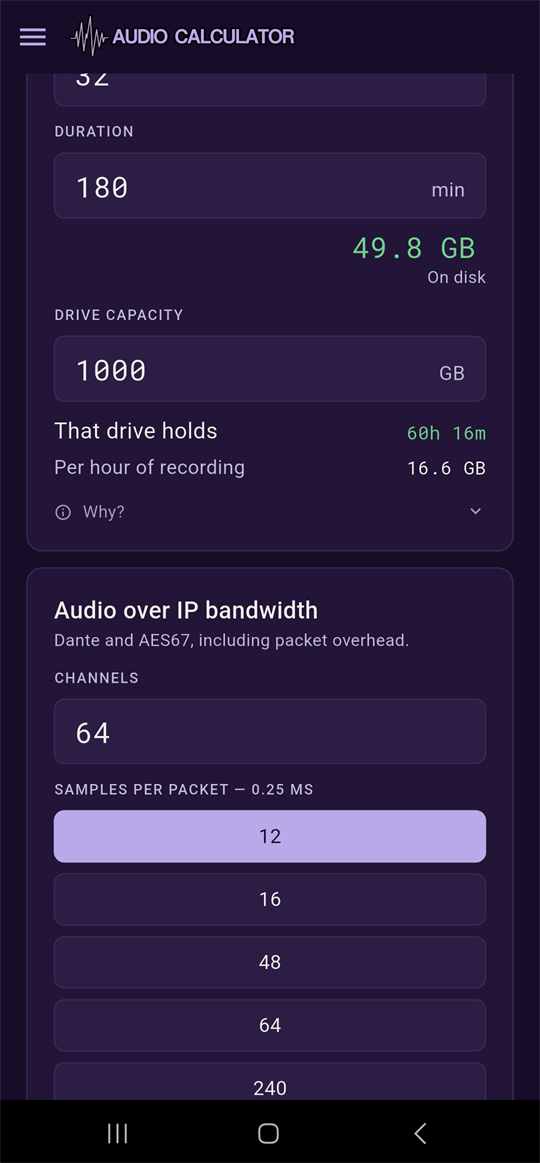
Audio over IP bandwidth
Dante and AES67 bandwidth including packet overhead, from a channel count, samples per packet, and channels per flow.
Pitch shift and sample rate
The tape-speed kind of pitch shift, where pitch and length move together. Work it out from a semitone shift, or from a recorded-at and played-at sample rate pair.
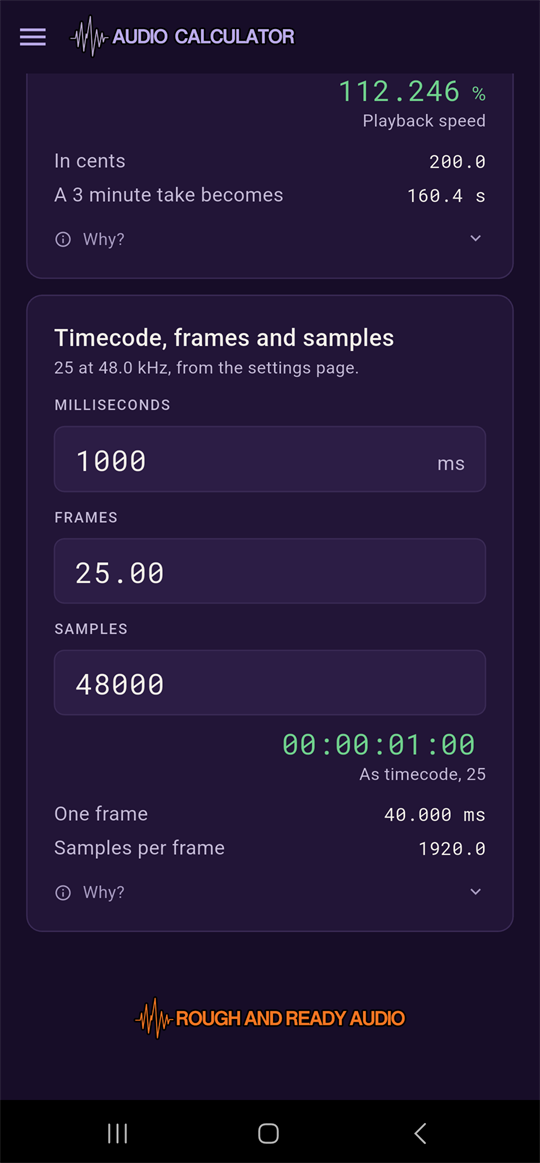
Timecode, frames and samples
Converts freely between milliseconds, frames and samples, at your Settings frame rate and sample rate. Type into any of the three boxes.
A note appears when a frame rate does not divide evenly into whole samples. Drop frame changes what the counter reads, never how long a frame actually lasts. See Understanding the pages.
Page 4
Power & electronics
Amplifier loading, cabling, power distribution and heat.
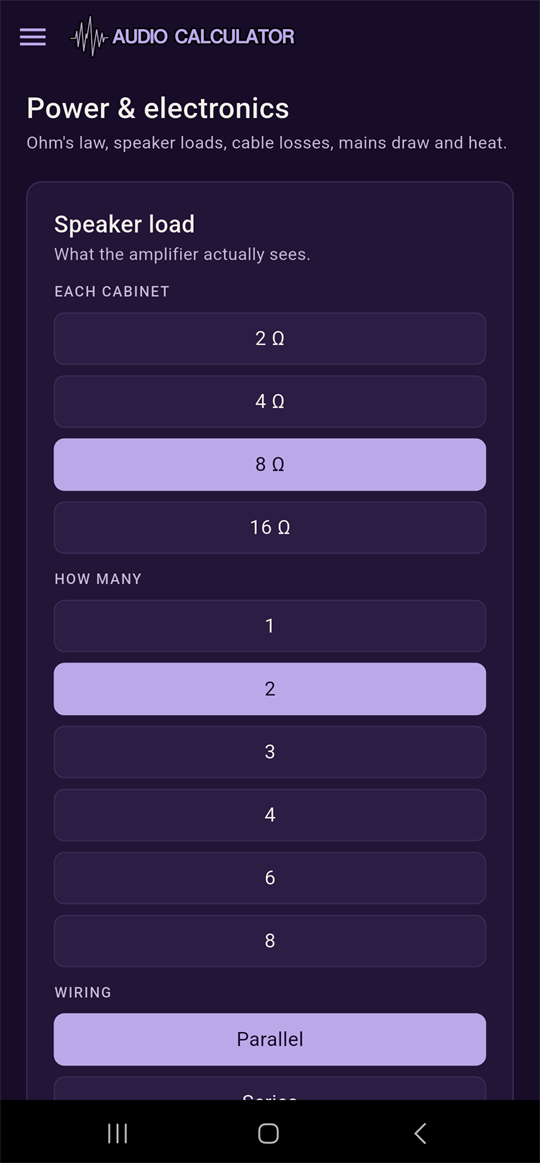
Speaker load
What an amplifier actually sees, from each cabinet's impedance, how many of them there are, and whether they are wired in parallel or series. Give it an amplifier's rated power at a rated impedance and it also tells you the power it will actually deliver into your load.
Ohm's law
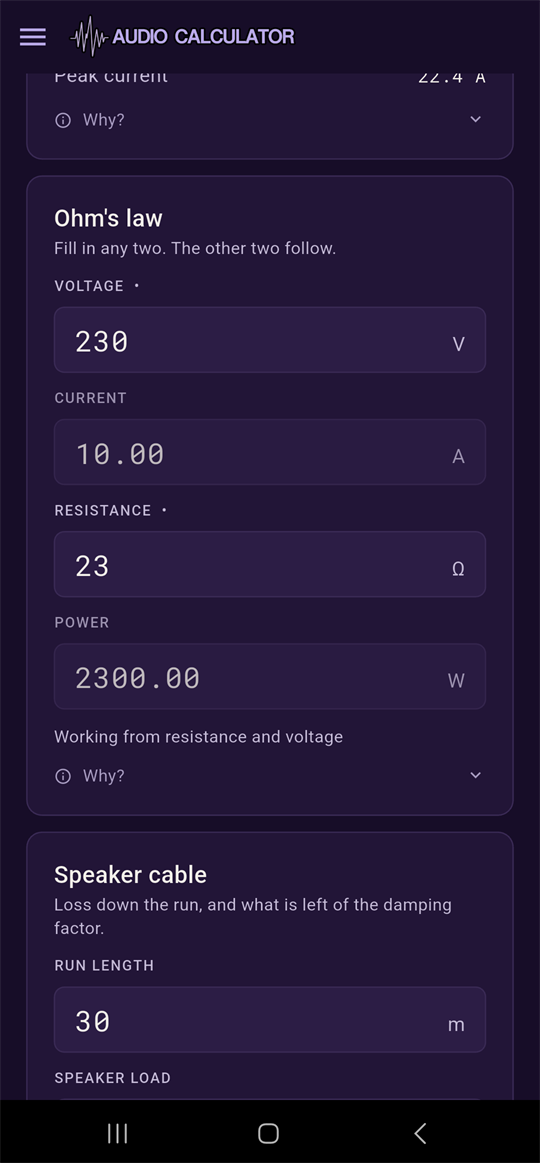
Fill in any two of voltage, current, resistance and power, and the other two follow. The two boxes you typed into most recently are treated as the knowns and marked with a small dot, so there is nothing to clear before working from a different pair.
Speaker cable
Loss down a cable run, and what is left of a published damping factor by the time it reaches the speaker, from the run length, the speaker load and the conductor size in AWG or mm².
Mains draw
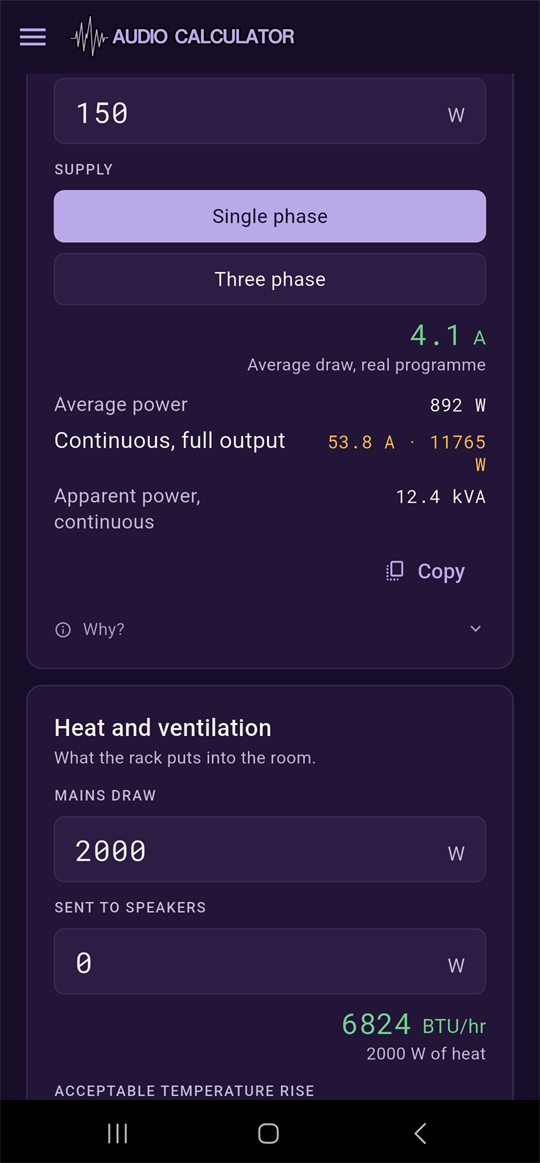
Two figures from a total amplifier output, an efficiency, a power factor, a programme crest factor and an idle draw: continuous draw at full output, and average draw for real programme material.
Heat and ventilation
What a rack puts into a room, in BTU/hr, from the mains draw and how much of that is actually delivered to the speakers, plus the airflow needed to hold a given temperature rise.
Settings
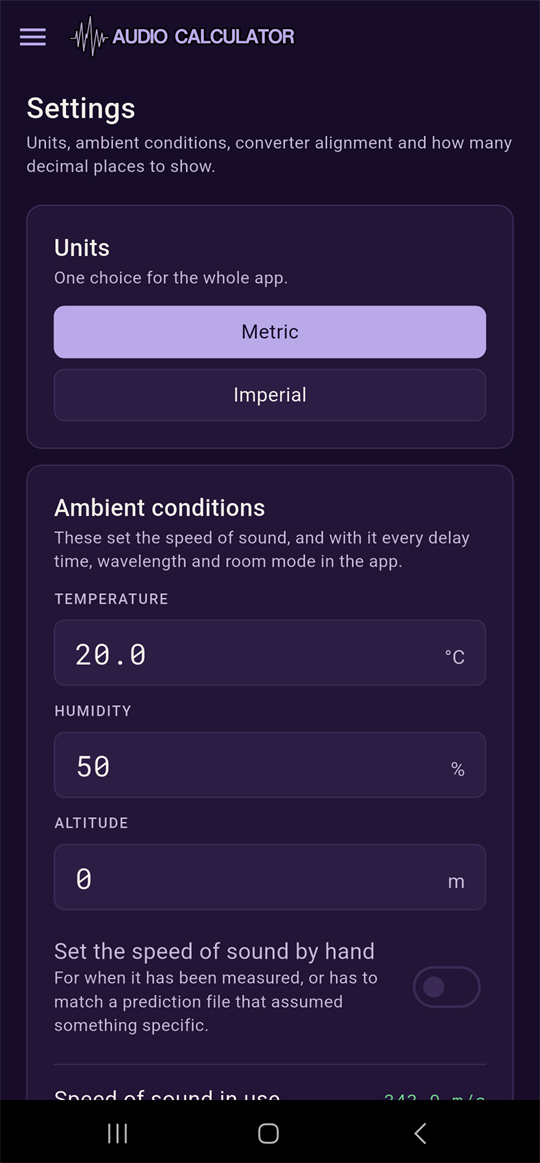
Nothing here is a preference in the sit-in-a-corner-and-be-ignored sense. The temperature changes the speed of sound, and the speed of sound changes every delay time, wavelength and room mode in the app. It is worth two minutes.
- Language & region
- UK or US English, for the whole app. This is the choice you made on first launch, and changing it here only affects spelling.
- Units
- Metric or Imperial, for the whole app.
- Ambient conditions
- Temperature, humidity and altitude, which together set the speed of sound used everywhere. Temperature does almost all of the work, humidity a little, and altitude almost none: it is only here because it decides how much water vapour a given humidity actually represents. There is a switch to set the speed of sound by hand instead, for when you have measured it directly.
- Converter alignment
- Which analogue level reads as full scale, used by the Analogue to digital tool. There is no single industry standard, which is somehow worse than there being none at all.
- Digital defaults
- Sample rate, bit depth and frame rate, used by the storage, network, latency and timecode tools.
- Electrical
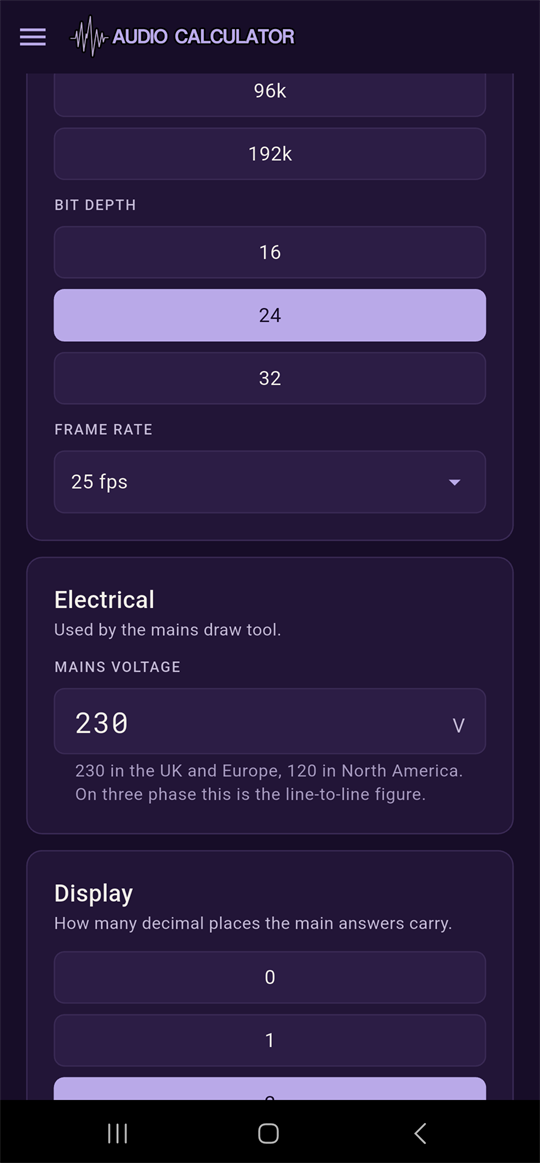
- Mains voltage, used by the Mains draw tool.
- Display
- How many decimal places the main answers carry, two by default. A delay time given to three decimal places claims microsecond precision from a distance somebody paced out, which the inputs do not support.
- Start again
- Puts every setting on this screen back as it came.
Understanding the pages
- The speed of sound is not a constant
- It depends on temperature above almost everything else, with humidity a smaller factor and altitude smaller still. A figure worked out at a cold outdoor evening soundcheck and reused at a hot afternoon show can be out by enough to matter over a long throw. That is why it is set once in Settings rather than assumed to be 343 m/s everywhere.
- Drop frame
- Changes what the timecode counter reads, never how long a frame actually lasts. No picture or audio is lost. Two frame numbers a minute are skipped so that the timecode clock keeps up with the wall clock, which otherwise drifts by 3.6 seconds an hour at 29.97 fps.
- Copying results
- Several tools carry a Copy button that puts a full plain-text answer on the clipboard, not just the headline figure but the inputs and the conditions it was worked out under. A delay time pasted into a show file that still says what temperature it assumed is worth having.
- Two-way boxes
- Most converters here work in both directions, so you can type into whichever box you happen to know. There is no designated input and no need to clear anything first.
Troubleshooting
An answer changed after I changed the temperature in Settings
That is expected. Every acoustics tool, including wavelength, delay times, room modes and reverberation, reads the single speed-of-sound figure in Settings. If a figure still looks wrong, check that "Set the speed of sound by hand" is not quietly overriding your temperature.
A tool's answer looks wrong after switching units
Geometry and level fields keep the number you typed, and only the label changes. Switching units never silently converts a value you have already entered. If an answer looks off, check whether the field is expecting the new unit's convention, metres against feet, rather than assuming a conversion happened for you.
Which setting is a given tool reading from?
Every subtitle under a tool's title says so directly, for instance "At 48.0 kHz, set on the settings page". Check there first rather than assuming a tool has its own hidden default.
I changed the custom converter alignment and want to go back to a standard
Turn off "Use a custom alignment" in Settings, under Converter alignment. The standard picker underneath takes over again immediately.
The answer for two similar levels came back blank
That is the Taking a level away tool declining to guess. When the two figures are within about half a decibel of each other, the result would be dominated by measurement error, so it gives you nothing rather than something misleading.
FAQ
Is any of this app paid?
No. Audio Calculator is completely free, with no unlock, no Pro version and no in-app purchases. The other apps in the family have a paid tier; this one does not.
Where did Main to fill delay and Comb filtering go?
Both were removed. A fill delay is a straightforward job for Time and distance already, and comb filtering rarely needed a calculator of its own once phase and delay had a dedicated tool. Sub Array Designer and Time Align Pro are the tools to reach for once delay work gets more involved than a single figure.
Why do some cards show a small answer and others a big one?
A tool with one answer standing on its own gets the full hero size. A tool whose main figure sits above several supporting figures, such as Time and distance, Level against distance or Reverberation, uses a smaller right-justified figure instead, so it reads as the first among equals rather than as a different kind of thing from the numbers underneath it.
Do the "Why?" explanations change depending on my input?
They are fixed text about the tool itself rather than a live commentary on your current numbers. Reverberation is the one exception: its Schroeder frequency disclosure states the actual computed frequency, because that figure is the whole reason for opening it.
Does this app need microphone permission?
No. Nothing here listens to anything. It is arithmetic, so it asks for no permissions at all.
Glossary
- Free field
- An idealised space with no reflections, which is the assumption behind the inverse-square Level against distance tool.
- Critical distance
- The point at which direct sound and the reverberant field are equally loud. Past it, level stops falling with distance.
- Directivity Q
- How concentrated a source's output is compared with a true point source. It is 1 for omnidirectional, and higher for anything more directional.
- Crest factor
- How far a signal's peaks sit above its average. Low for a sine wave, high for uncompressed transient material.
- Alignment level
- The analogue voltage that a digital system's full scale represents. There is no single industry standard, which is why it is a Settings choice rather than a fixed constant.
- Drop frame
- A timecode convention that skips certain frame numbers to keep the displayed clock in step with real time, without changing how long any actual frame lasts.
- RT60
- How long it takes a room's reverberation to fall by 60 dB after the source stops.
Version history
| Version | Notes |
|---|---|
| 1.2.0-beta.1 | UK and US English throughout, chosen on a short first-run screen alongside Metric or Imperial units, and changeable afterwards from a Language & region card on Settings. |
| 1.1.0-beta.1 | Main to fill delay and Comb filtering were removed from Wave & acoustics. Every card's caveat text now collapses under a "Why?" toggle instead of staying permanently visible, applied app-wide. Hero answers that sit above supporting figures of their own, in Time and distance, Level against distance and Reverberation, now show smaller and right-justified rather than at full hero size. |
| 0.1.0 | Initial release: four pages of calculators covering acoustics, levels, studio and digital work, and power and electronics. |