
Welcome
An RTA shows you how loud a room is at every frequency, live, as a row of bars. It is the tool you reach for when something sounds wrong and you want to know where it is wrong. A boxy vocal, a room that rings on one note, a sub that is doing far more than you thought, a hiss that turns out to be a fan: all of those are obvious on a spectrum and hard to be certain about by ear alone.
Everything else in the app exists to make that picture more useful. There is a signal generator so you can feed the room something known instead of guessing from whatever the band happens to be playing, a set of weighting curves so the figure matches what a licence or a human ear cares about, and a calibration shared with every other Rough and Ready Audio app on the phone so the numbers are real decibels rather than an arbitrary scale.
Getting started
Here is the whole thing in one go: put pink noise into the PA, look at what comes back, and fix what you do not like.
- Pick your English. The very first screen asks whether you want UK or US English. It only changes spelling, and you can change your mind later in Settings.
- Let the app hear. The first time you open it, RTA asks for microphone permission. Say yes, or there is nothing to analyse.
- Calibrate, if you want real decibels. You can use the analyser perfectly well without calibrating, because the shape of the spectrum is right either way. Calibrate when you want the vertical scale to read dB SPL rather than dB full scale. See Calibration.
- Turn the phone sideways. The app runs in landscape. A spectrum is a wide thing, and squeezing 20 Hz to 20 kHz into a portrait screen helps nobody.
- Set up a signal. Open the Signal generator from the drawer and choose pink noise. Set a level, somewhere around -20 dBFS to start.
- Plug the phone into the system. Headphone output or USB into a spare channel on the desk, then bring it up on the PA at a sensible level. Loud enough to sit well clear of the room's noise floor, not so loud that anybody has to leave.
- Start it. Go back to the Analyser screen and press the generator button there. That is deliberate: the button lives on the screen where you can see what it is doing.
- Watch the spectrum. Pink noise into a flat system draws a flat line across this display. Anything that is not flat is either the room, the system, or the microphone, and that is what you are there to work out.
- Steady the picture. Set the averaging to Slow or longer. An instant display of pink noise looks like a thunderstorm and tells you nothing.
- Move around. One position tells you about one position. Walk the room, taking a moment at each spot, and treat what is common to all of them as the system and what changes as the room.
Free and Pro
RTA is free to download, and the free app is a real analyser rather than a demonstration of one. It hears correctly, it calibrates fully, and it will do the core job of showing you what a room is doing.
- RTA gives you the full analyser at 1/12 octave resolution with Z-weighting, Fast and Slow averaging, the complete calibration system, peak hold, the clip indicator, the automatic ringing marker, and pink noise from the signal generator. Z is flat and unweighted, which is exactly what you want for tuning a system, so the free app is set up to do the job rather than to tease you.
- RTA Pro unlocks A, C and K weighting, every other band resolution from a whole octave down to 1/48 and full FFT resolution, the Instant, 4 second, 10 second and Infinite averaging settings, and the white noise, sine and sweeping tone generators.
Locked options are still shown in the pickers rather than hidden, dimmed with a small padlock next to them, so you can always see the full list. Tapping one tells you it is a full-version option and points you at Settings instead of applying it. The unlock is a single one-off purchase for this app on this device, not a subscription, and it sits on a card at the top of the Settings screen with a Restore purchase button underneath for reinstalls and new handsets.
The Analyser screen
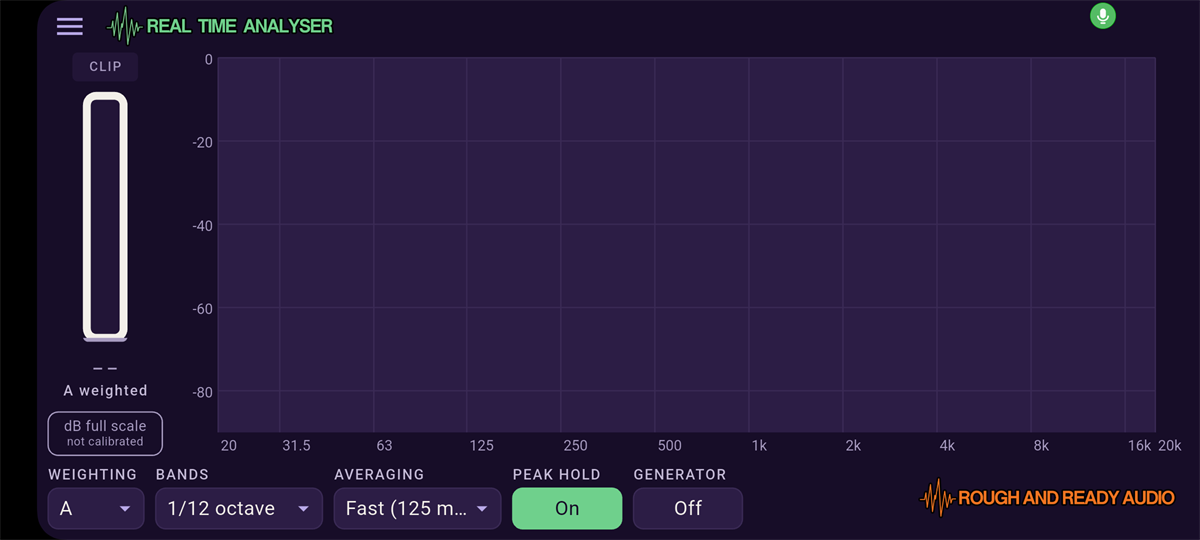
A level meter runs down the left at full height, and the spectrum plot fills the rest of the screen: a row of bars, one per band, updating live. A row of pickers along the bottom shapes what both of them are showing.
Reading the spectrum plot
Frequency runs left to right, 20 Hz to 20 kHz. Level runs bottom to top over a 90 dB range, which covers everything from an empty hall to the same hall during the encore. Once calibrated you can set the top and bottom yourself on Settings.
Under the meter there is a badge telling you which scale you are on. It reads dB full scale, with not calibrated underneath it, until the microphone has been calibrated, and turns green reading dB SPL once it has. Expect the picture to jump at that moment: uncalibrated, the plot runs -90 to 0 dBFS, and calibrating swaps it to the sound pressure range set on Settings.
The bar down the left is the broadband level, which is everything the microphone can hear added together. It follows the same averaging setting as the bars, because it is drawn from the same averaged spectrum they are.
Weighting
Weighting is a curve applied across the spectrum so that the figure reflects something specific rather than treating every frequency the same.
- A
- The Fletcher-Munson equal-loudness curve for quiet sound. The ear barely hears bass at low levels, so this rolls the bottom end away to match. It is the one to set for noise compliance work, because that is what almost every noise limit is written in. Pro
- C
- The same idea at high levels. Loud sound is heard much more evenly across frequency, so this stays nearly flat down to 20 Hz. Reach for it when the low end is what you are interested in. Pro
- Z
- Flat. No weighting at all. This is the one to tune a system on, because it shows you what the PA is actually doing rather than what an ear makes of it, and it is why Z is the setting the free app runs on.
- K
- The ITU-R BS.1770 curve behind LUFS. For checking a system against a broadcast or streaming loudness target. Pro
Resolution
How finely the spectrum is sliced, from a whole octave at the coarse end, through thirds, sixths, twelfths, twenty-fourths and forty-eighths, to Full resolution, which draws every FFT bin as a line rather than as bars.
There is a real trade here, and it is worth understanding rather than just picking the finest. Narrow bands need a longer analysis window, and a longer window is a slower one. The coarse resolutions stay quick enough to watch somebody talk. The fine ones show you detail you cannot get any other way, but they lag, and on a phone microphone they also show you a lot of noise at the bottom end that a coarser setting would have smoothed over.
As a rough guide: octave and third-octave for setting a system by eye against pink noise, twelfth-octave as an everyday default, and the finest settings for hunting one specific ringing frequency you already suspect is there. Pro (every resolution except 1/12 octave)
Averaging
How much history goes into each bar before it is drawn. This matters more than almost anything else on the screen, because the same room looks completely different at either end of the range.
- Instant
- Every frame as it arrives. Twitchy and hard to read on music, but the best setting for hunting a ringing frequency, because a ring is the thing that stops moving while everything else jumps about. Pro
- Fast (125 ms) and Slow (1 s)
- The same time constants a sound level meter uses. Slow is a good general default for reading a room, and both are in the free app.
- 4 seconds and 10 seconds
- 4 s is steady enough to walk around with and to see past one person shouting near the phone. 10 s is very steady indeed, and is the setting for dialling in system EQ from pink noise. Pro
- Infinite
- A running mean of everything since the last reset. It never settles on a moving signal, which is exactly what makes it right for a stationary one: the longer it runs on pink noise, the more the randomness averages out and the more clearly the system's real response emerges. Clear it from Settings before it can say anything about a new position in the room. Pro
The ringing marker
An amber caret and a frequency label appear over the loudest band, and the bar itself turns amber, but only once that band stands clear of everything around it.
The reason for the restriction is that on ordinary programme material there is always a loudest band, and a marker that pointed at it every frame would jump about constantly while telling you nothing. When something is genuinely ringing it stops moving, and that is when the marker appears. It turns "something in here is too loud" into a specific number you can go and do something about, which is what you actually want at the moment a monitor starts to sing.
Peak hold is a separate thing. It adds a thin notch over each band's own recent high point, all bands at once, whether or not anything is ringing. The Peak hold button on the control strip is a plain on and off, and holding it down clears every notch without switching peak hold off, which is what you want after one loud bang you were not trying to measure. The choice between the two hold modes is on Settings.
- Hold and fall
- the default. Each notch decays away once it has stopped being informative.
- Hold until reset
- every notch freezes where it is. Use this to catch the single loudest moment of a set, then read it back afterwards.
The Signal Generator screen
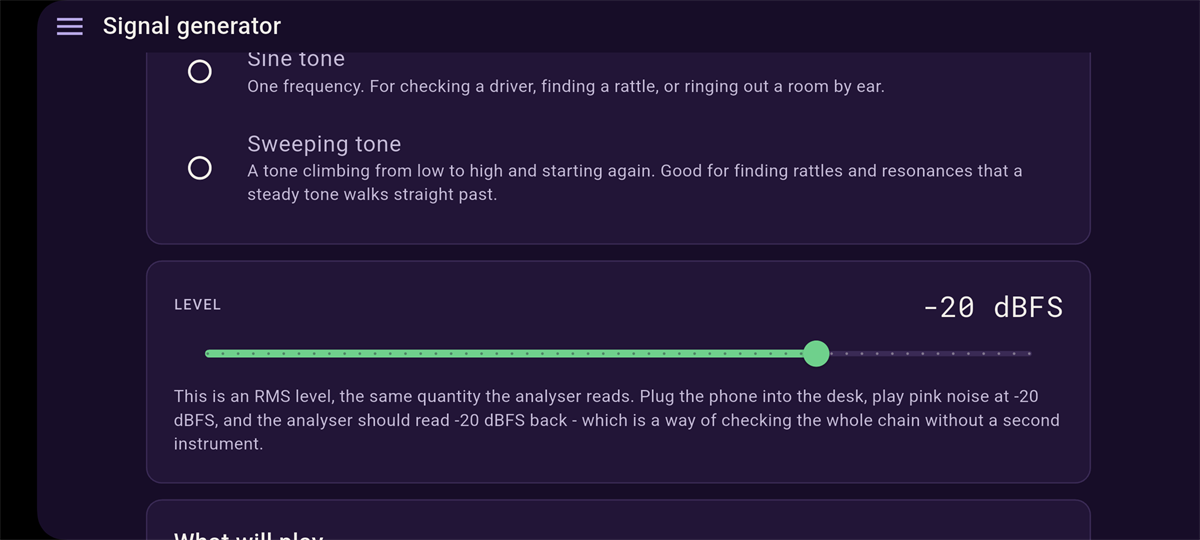
This is where you choose what the generator plays and how loudly. The button that actually starts and stops it lives on the Analyser screen, because that is where you need it with a system in front of you.
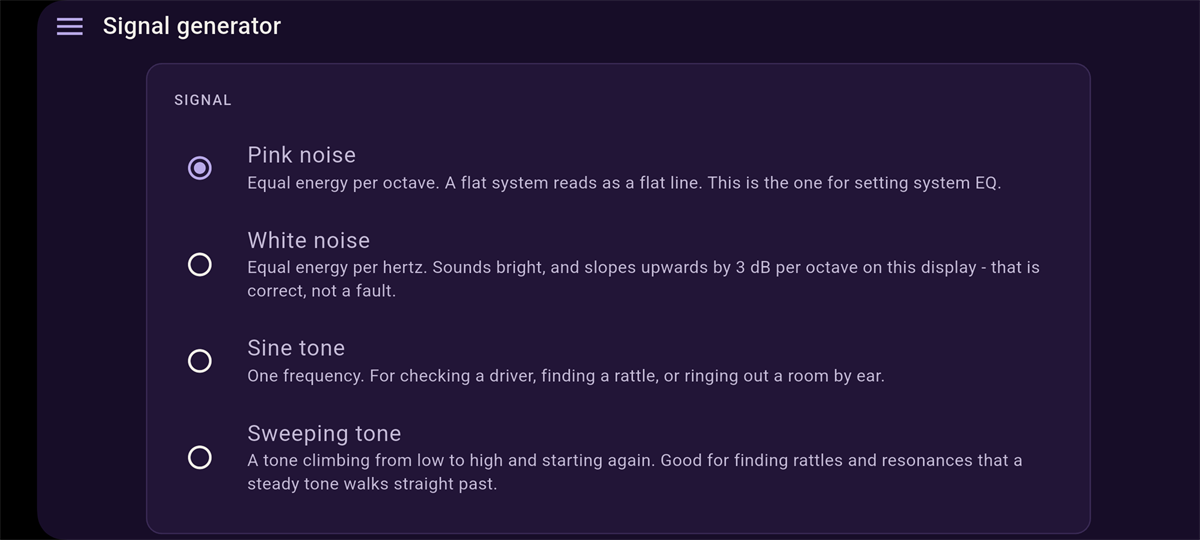
- Pink noise
- Equal energy per octave. This is the one you will use most. A flat system reading pink noise draws a flat line on this display, which makes it the obvious choice for setting system EQ. It is in the free app.
- White noise
- Equal energy per hertz. It sounds distinctly bright, and it slopes upwards by 3 dB per octave on this display. That is correct and not a fault: white noise really does have more energy in the top octave than the bottom one, because the top octave is wider. Pro
- Sine tone
- One frequency at a time, adjustable on a log-scaled slider from 20 Hz to 20 kHz, with quick presets at 50, 100, 250, 440, 1000 and 4000 Hz. Good for checking a driver is alive, finding a rattle, or ringing out a room by ear. Pro
- Sweeping tone
- A tone climbing steadily from low to high and starting again, fading at each end so the loop repeats without a click. This is the one for finding rattles and resonances, because a steady tone will walk straight past a buzz that only happens at one specific frequency. Point it at a room and listen for what joins in. Pro
Calibration
Calibration is what turns the vertical scale from dB full scale into real dB SPL. You do not need it to use the analyser, because the shape of the spectrum is right regardless, but you do need it the moment you want to say how loud something actually is.
A microphone's sensitivity belongs to the handset rather than to the app, so whatever you calibrate here is handed to every other Rough and Ready Audio app on the phone, and anything they have already calibrated is used here.
- Against a sound level meter
- The route most people will take. Borrow a meter you trust, and the app walks you through four steps: confirm the reference meter is set to A-weighting, then take readings at roughly 65, 75, 85 and 95 dB, typing in what the reference says each time. Put the two microphones as close together as you sensibly can, somewhere reasonably quiet, and work up through the levels.
- Acoustic calibrator
- The quick and precise route if you have a USB measurement microphone and a calibrator that fits over it. Choose 94, 104 or 114 dB to match your calibrator, switch it on, and measure for five seconds.
- Microphone calibration file
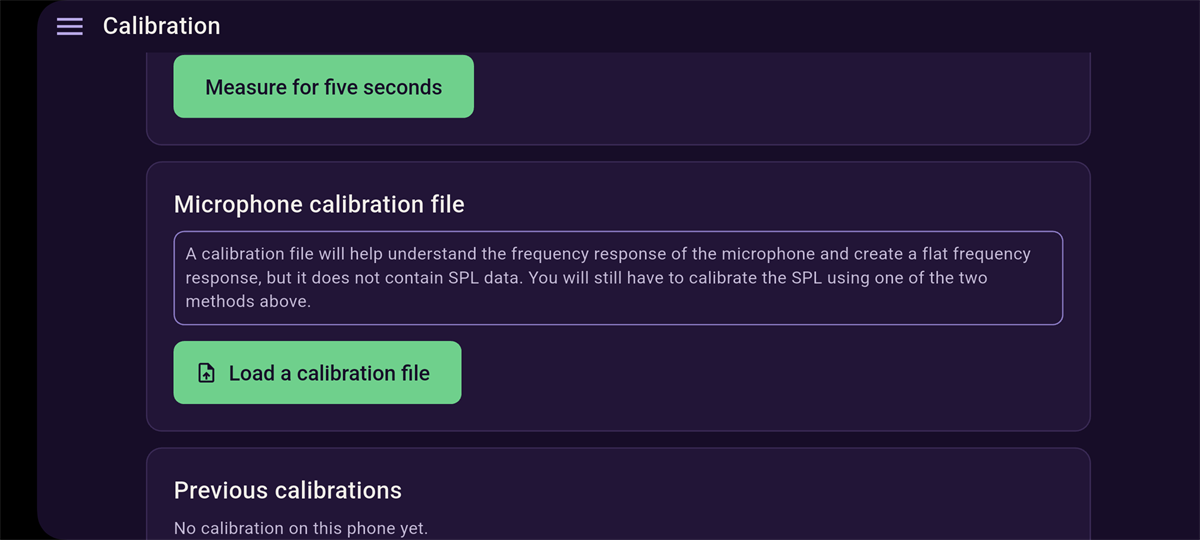
- The one calibration step that is genuinely specific to this app rather than shared. It loads a microphone's frequency response file so the analyser can flatten its display against that microphone's own shape, which matters a great deal if you are using a measurement mic with a published response. It carries no level information at all, so you still need one of the two routes above for the numbers to mean decibels.
Settings
- Language & region
- UK or US English, for the whole app. This is the choice you made on first launch, and changing it here only affects spelling.
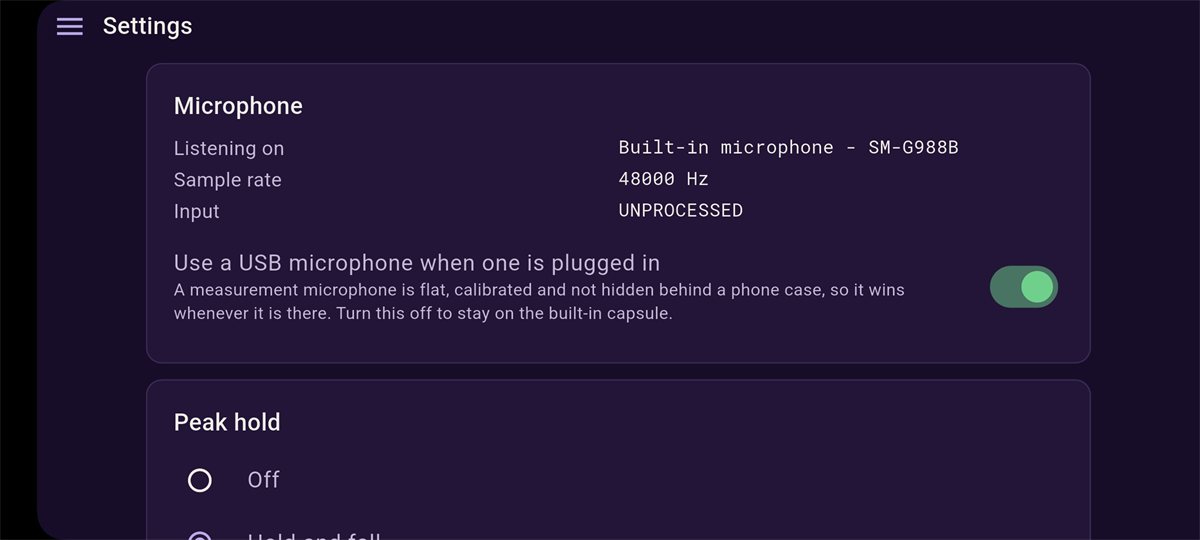
- Microphone
- What is in use, its sample rate and input path, and a switch, Use a USB microphone when one is plugged in, that moves to one automatically and back to the built-in mic when it is unplugged. A proper measurement microphone is flat, calibrated and not hidden behind a phone case, so it is worth having it win automatically whenever it is there.
- Scales
- The top and bottom of the spectrum plot and of the level meter, set separately. Both apply once a microphone is calibrated; until then the axis is dB full scale, where the top is the converter running out and there is nowhere above it to go.
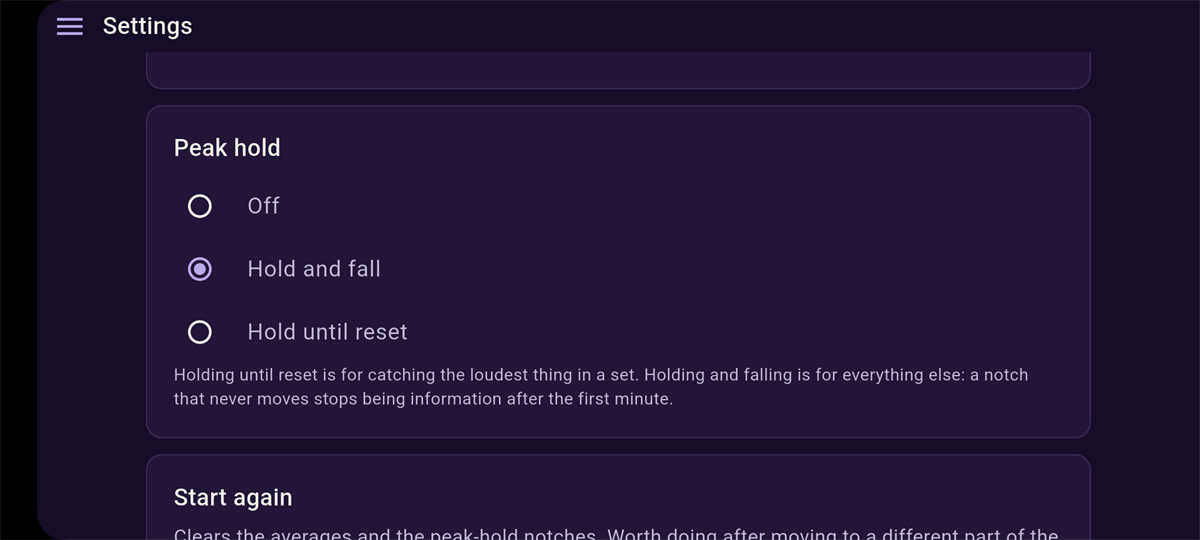
- Peak hold
- Off, Hold and fall, or Hold until reset. See The ringing marker for what each of these does to the plot itself.
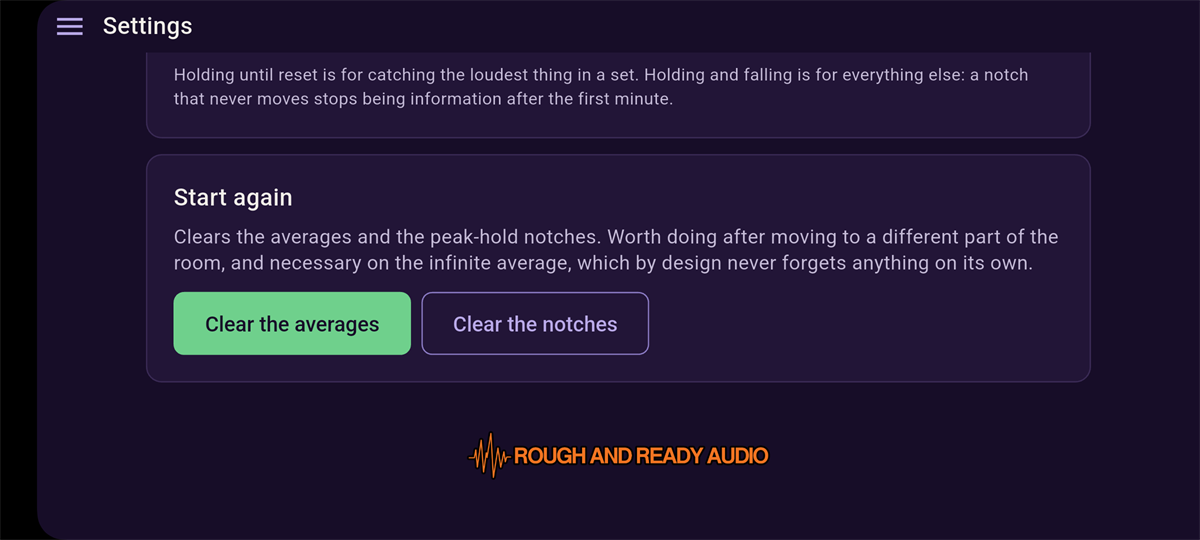
- Start again
- Two separate resets, one for the running averages and one for the peak-hold notches. Worth doing every time you move to a different part of the room, and essential on the Infinite average, which by design never forgets anything on its own.
Understanding the display
What you are looking at
A spectrum is a snapshot of energy against frequency. Each bar answers the question "how much sound is there around here", where "here" is a slice of the frequency range whose width you set with the resolution control.
What it is not is a picture of what the system sounds like. Two rooms with identical spectra can sound completely different, because a spectrum says nothing about timing: reflections, ringing decay and phase all live outside it. The RTA tells you how much, not how long, which is why a spectrum is a starting point for a conversation with your ears rather than a replacement for them.
Reading it honestly
A few things worth keeping in mind while you look at it.
- One position is one position. Bass in particular changes enormously over a couple of metres. Anything you see in one spot that disappears three steps away is the room, not the PA, and equalising it out will make things worse everywhere else.
- Pink noise into a flat system draws a flat line, so pink noise is the signal to judge a system against. Music is not, because music has its own spectrum baked in, and no mix has ever been flat.
- The bottom end will look noisier than it is on a phone microphone, especially at fine resolutions. Handling noise, air conditioning and the phone's own limitations all pile up down there.
- Averaging changes what you believe. The same room looks peaky on Instant and smooth on 10 s. Neither is lying; they answer different questions. Use a long average for anything you intend to act on with an EQ.
What the numbers are not
Even calibrated, this is a phone microphone. It is genuinely useful once matched against a good reference, and for the everyday job of finding what is wrong with a room it is more than good enough. It is not a substitute for a measurement instrument where a figure has to carry legal weight of its own.
Troubleshooting
No signal is showing at all
Check that microphone permission was granted, and that nothing else on the phone is holding the microphone open. A voice recorder or a video call left running in the background will take it. The "nothing to hear" screen offers a direct retry once the input is free again.
The generator does not seem to be audible
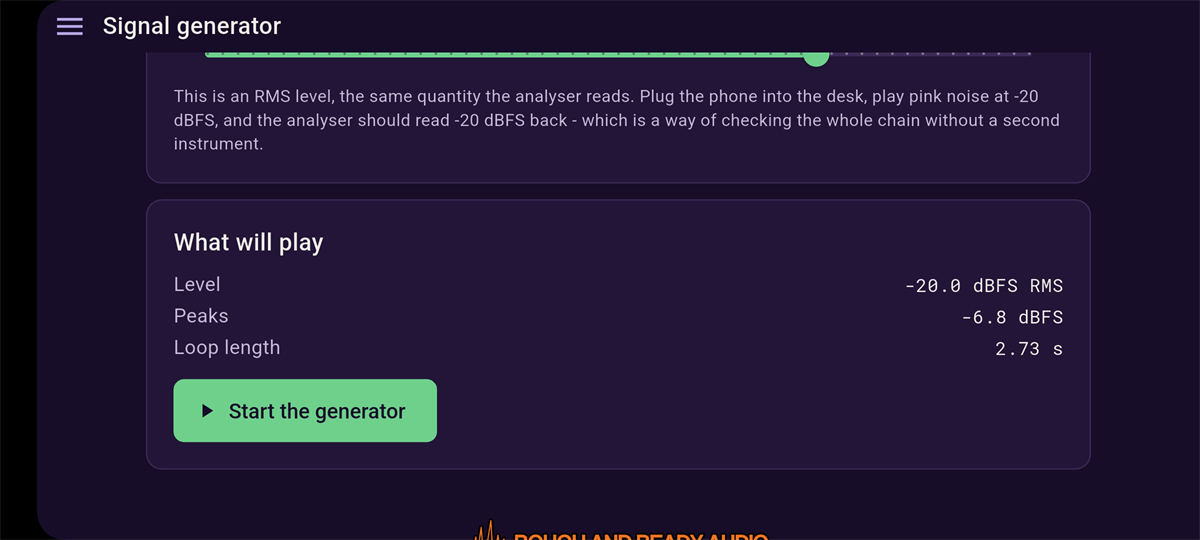
First confirm it has actually been started. The start button lives on the Analyser screen rather than on the Generator screen itself, which catches people out. Then check the phone's own media volume and where its output is routed. The "What will play" card on the Generator screen tells you the level and the peaks it is about to produce before you start it, so you can rule the app out quickly.
The spectrum looks noisy at low frequencies
Phone microphones are limited at the bottom end, and finer resolutions make that noise more visible rather than less. Try a coarser band resolution, or Slow or 4 s averaging, to steady the picture. Treat the very lowest bands with a degree of scepticism on any phone, and use a USB measurement microphone if the low end is the whole point of what you are doing.
A calibration file will not load
A response file describes the shape of a microphone that has already been calibrated for level. Take a calibration first, by either the comparison or the calibrator route, and then load the file. Loading one before that has nothing to attach itself to.
An option in a picker is greyed out with a padlock
That option is part of RTA Pro. Locked options stay visible rather than being hidden, so you can see the whole list, but tapping one points you at Settings instead of applying it. See Free and Pro.
The whole spectrum moves when somebody walks past
That is real, and it is one of the more useful things an RTA teaches you. A body between the PA and the microphone is a substantial obstacle at high frequencies. It is also a good reason to put the phone on a stand rather than holding it, and to use a longer average for anything you plan to act on.
FAQ
Why does RTA offer K-weighting when SPL Meter does not?
K-weighting is a loudness curve for programme material rather than a sound level weighting. It is useful here for checking a system against a broadcast or streaming loudness target, but no noise limit has ever been written in it, which is why SPL Meter leaves it out rather than inviting somebody to report a figure nobody asked for.
Does calibrating here also calibrate SPL Meter?
The SPL calibration, yes. It is shared across every Rough and Ready Audio app on the phone. A microphone calibration file loaded here is different: only this app uses that shape, and only to flatten its own display.
What is the difference between the ringing marker and peak hold?
The marker points at one specific frequency, the loudest band, and only once it is clearly ringing rather than just momentarily loudest. Peak hold puts a notch over every band's own recent high point, all at once, regardless of whether anything is ringing at all.
What resolution and averaging should I use for setting system EQ?
Third-octave or twelfth-octave resolution with 10 s or Infinite averaging, on pink noise, with Z-weighting. Anything faster will have you chasing noise, and anything weighted will have you correcting for a curve that is already in your ears.
Can I use this to ring out monitors?
Yes, and it is one of the better uses for it. Instant or fast averaging with a fine resolution will pick out a ringing frequency almost immediately, and the marker gives you the number to reach for on the EQ. Bring the wedge up slowly and stop as soon as the marker settles on something.
Is the Pro unlock a subscription?
No. It is a single one-off purchase for this app on this device, and there is a Restore purchase button on the same card for reinstalls or a new handset.
Glossary
- dB full scale
- Decibels relative to digital full scale. What an uncalibrated reading is measured in.
- dB SPL
- Decibels of sound pressure. What a calibrated reading becomes.
- Band
- One bar on the spectrum plot. A slice of frequency, whose width is set by the resolution you choose.
- Ringing
- A frequency that has stopped moving and is sitting louder than everything around it. This is the condition that makes the marker appear, and the thing you are hunting when a monitor starts to sing.
- Crest factor
- How far a signal's peaks sit above its average level. It is the reason the generator sometimes turns a requested level down to keep noise inside full scale.
- Pink noise
- Noise with equal energy in every octave, which is why a flat system reproducing it draws a flat line on this display.
- FFT
- The mathematics that turns a moment of sound into a spectrum. Full resolution shows you its output directly, one point per bin.